Anatomy of an API Request to Kube-API Server.
The Kube-API Server is a collection of REST endpoints, accepting json as inputs from various clients (like kubectl) and using the inputs to manage the state of the cluster. Examining the HTTP conversation between the Kube-API Server and native K8s objects like Pods can be used to troubleshoot communication errors within the cluster.
A sneak peek into a HTTP request from kubectl to Kube-API Server.
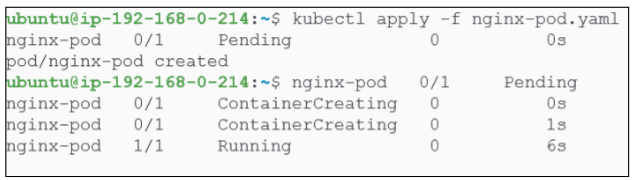
Assume we want a pod hosting an nginx container.
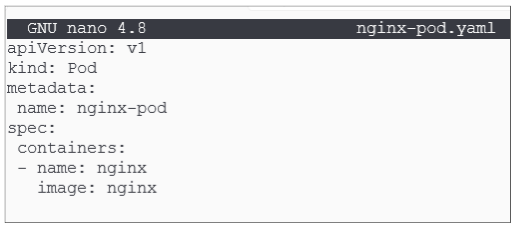
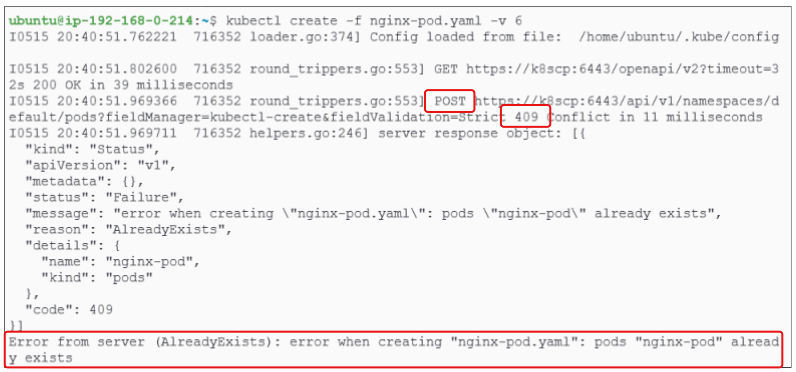
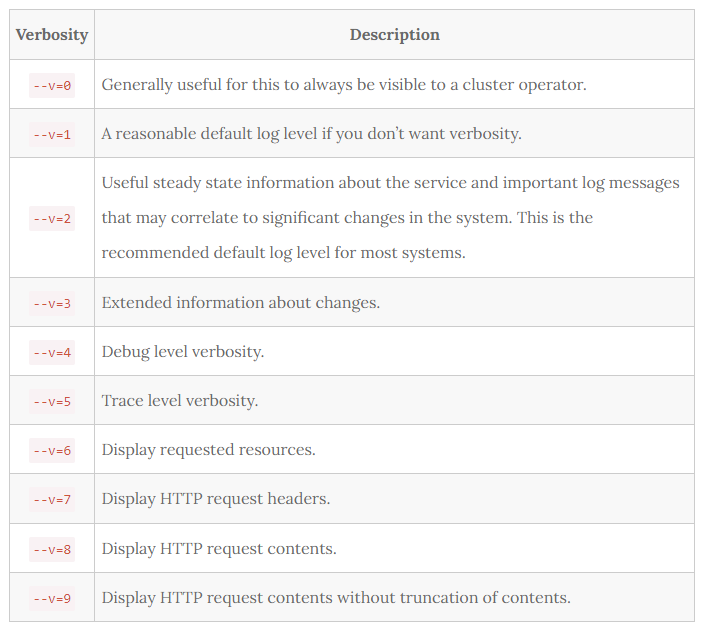
We can use kubectl create -f <name of YAML manifest for pod> to generate this pod. However, we will append -v 6 to the end of the create command to get a verbose response printed on the terminal.
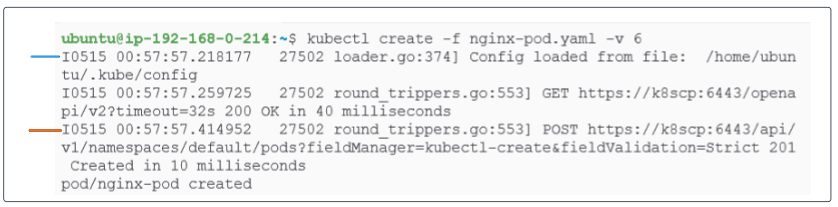
Lets examine the two lines in the response printed:
- The blue line shows kubectl loading the kube config file to extract 2 major bits of information: (a) the url of the node where the kube-api server is located and (b) the authentication token that will let kube-api server know that the caller (in this case, the kubectl instance) is trusted.
- The red line shows a POST command was sent which resulted in a 201 HTTP status code indicating the pod was created.
Get information about the pod.
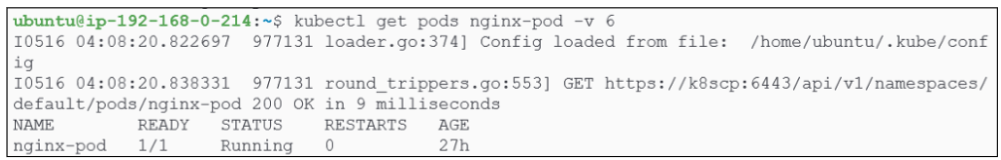
Notice the url at which the pod is accesssible:
- https://k8scp:6443 is the address for the kube-api server.
- /api/v1/namespaces/default/pod/nginx-pod is the file containing the pods metadata.
Try to create the same pod again.
Run the kubectl create -f <name of pod manifest> again.
Using verbosity level 9 for detailed responses to be printed on console.

The response sent back from the kube-api server is very detailed and has a significant amount of metadata. A sample of this output is attached below:
Going through the contents of the file above, notice the metadata that has been provided as part of the response. It contains basic information on the nature of the pod as it is known by the kube-api server.
Deep dive into traffic exchange between client and kube-api server.
So far, we've been using kubectl commands with high verbosity levels to get a taste of the traffic that is flowing between the client (kubectl) and the kube-api server.
We can also use curl to directly send traffic to the kube-api server. However before doing that, we have to 'authenticate' curl (so that kube-api server feels ok sending back any sort of response) using the kubeconfig file that is stored on our node.
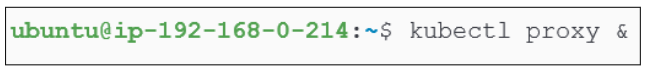
As soon as the proxy is started, it will be sent to the background (because of the '&') and you will also see the IP address on which it is listening for our commands.
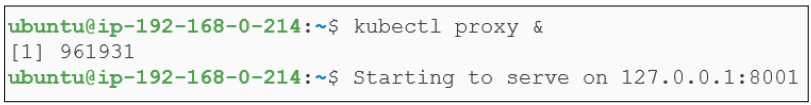
We can send our request to the proxy and it will relay it to the kube-api server on our behalf.
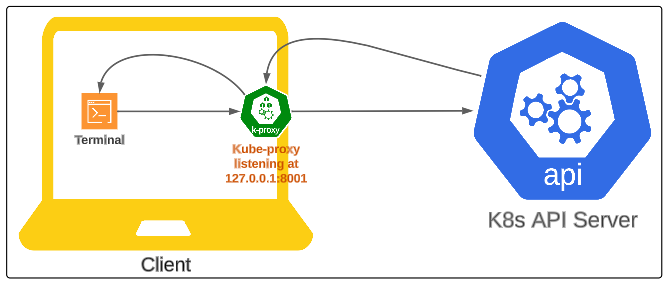
We can now issue a curl command to extract information on our nginx-pod pod.

- curl is the linux module that is used for establishing HTTP communication with some end point.
- http://localhost:8001 is the address of the kube-proxy that is acting like the intermediary for our HTTP communication.
- /api/v1/namespaces/default/pods/nginx-pod is the location on the kube-api server where nginx-pods metadata is saved (refer to Figure 3).
The response, as a result of the curl call in Figure 9 shows the same kind of meta-data for nginx-pod as was seen after the commands executed as per Figure 5.
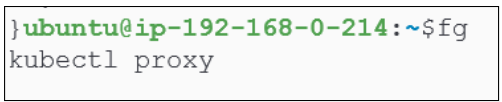
To turn the proxy off, bring it to the foreground, followed by pressing ctrl + c.
Adding a --watch to our kubectl commands.
The WATCH flag is considered a special API request.
Let's put a watch on all the pods in the cluster.
First, execute kubectl get pods --watch -v 6 & to
- Send a GET request to get a list of resources (in our case, pods)
- Put a watch on this list of resources using --watch
- Set verbosity level to 6, using -v 6 and
- Send the kubectl process to the background using &

As a result of the command in Figure 11, the response returned show minimal network chatter:
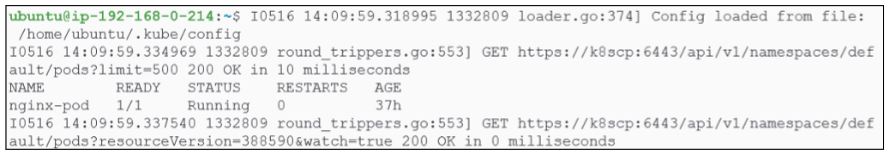
The response shows us the following happened:
- The kube config file was loaded to get the authentication token from it along with the location of the kube-api server.
- A GET request was sent to https://k8scp:6443/api/v1/namespaces/default/pods. The first 500 pods in the default namespace were returned in 10 milliseconds.
- a GET request was sent to https://k8scp:6443/api/v1/namespaces/default/pod?resourceVersion=388590 with watch set to true.
TLDR; k8scp is the alias used for the Control Plane.
What does resourceVersion=388590 mean?
With each change applied to the pods in the default namespace, resourceVersion changes. It is this changing value that tells watch something has changed and therefore should be tracked and displayed.
Finally, we can see that kubectl has kept the TCP session with kube-api server open and is waiting for data to flow back from there:

We can confirm that the kubectl process has indeed established a TCP connection with kube-api server since we do see ESTABLISHED 1332809/kubectl printed on the terminal.
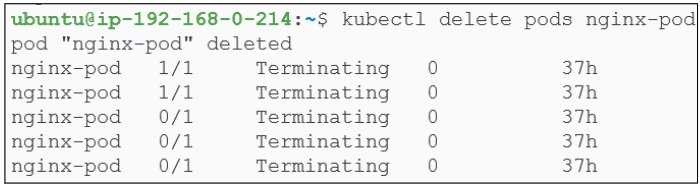
Testing the use of --watch by deleting and recreating a pod.
We start off with deleting nginx-pod first.
We could also bring the pod back and also view the stages kube-api goes through to create a pod.
Accessing logs: Another special API request.
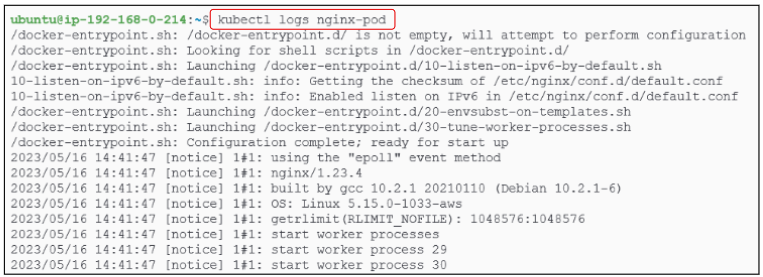
For a start, lets simply access logs for the pod and its underlying container.
Repeat the above with a verbosity level of 6.
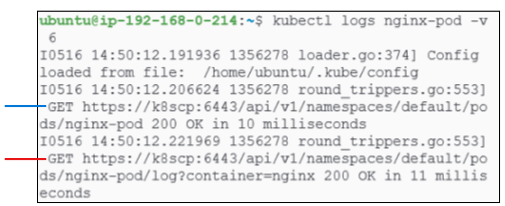
In addition to the outputs already seen in Figure 16, notice the multiple GET commands:
- The blue GET command is checking for the existence of nginx-pod and is returning with a 200 OK, confirmint the pod does exist.
- The red GET command is going a step deeper and also extracting the logs for nginx-pod.
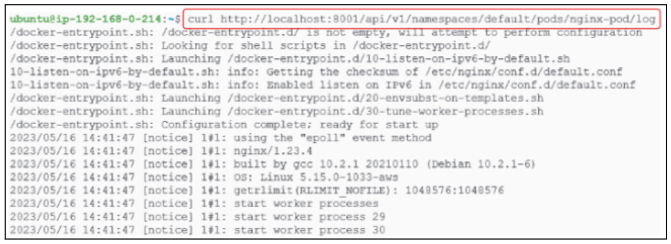
Logs can also be accessed through kubectl proxy.
As we did in previous examples, we can set up a direct proxy-led connection to the kube-api server (as shown in Figure 7 and Figure 8).
Once the proxy is active and listening, use curl to get access to the same logs from the same pod.
Checking authentication failures.
If we go through the responses generated by our -v 6 levels, one thing is obvious in all of them: the use of /.kube/config file to authenticate with the kube-api server. Once the authentication is successful, the remaining calls are sent and responses are received.
To demo authentication failure, we would need to make sure the /.kube/config information is either missing or incorrect.
- First make a copy of the actual /.kube/config file:

- Now edit the /.kube/config file and introduce an error in it. The easiest thing to change is the user name value:
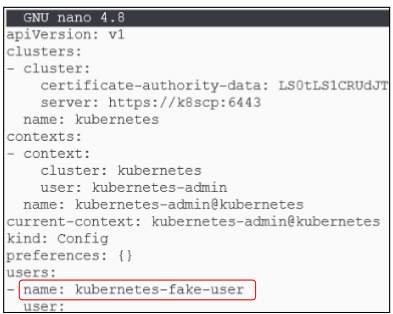
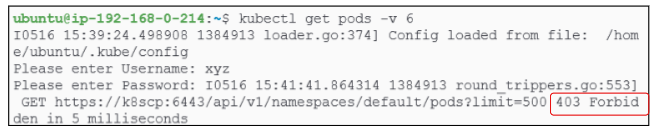
Once the error has been introduced, we can issue another GET request for all pods in the default namespace. A prompt asking for username and password will be issued since kube-api server does not know anything about kuberbetes-fake-user. Enter any random user name and password and press enter. The HTTP response that comes back will show a 403 Forbidden, indicating there is an authorization issue.
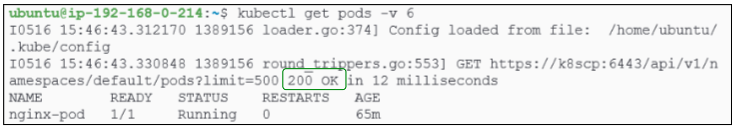
Revert the user name inside /.kube/config back to kubernetes-admin and attempt the get pods command again:
I write to remember and if in the process, I can help someone learn about Containers, Orchestration (Docker Compose, Kubernetes), GitOps, DevSecOps, VR/AR, Architecture, and Data Management, that is just icing on the cake.